Solar Activity
Monitor the Sun's surface live. Satellite imagery, coronal eruptions (CMEs) and coronal holes. All data comes directly from NASA and NOAA's SDO and SOHO satellites.
Live Satellite Monitoring
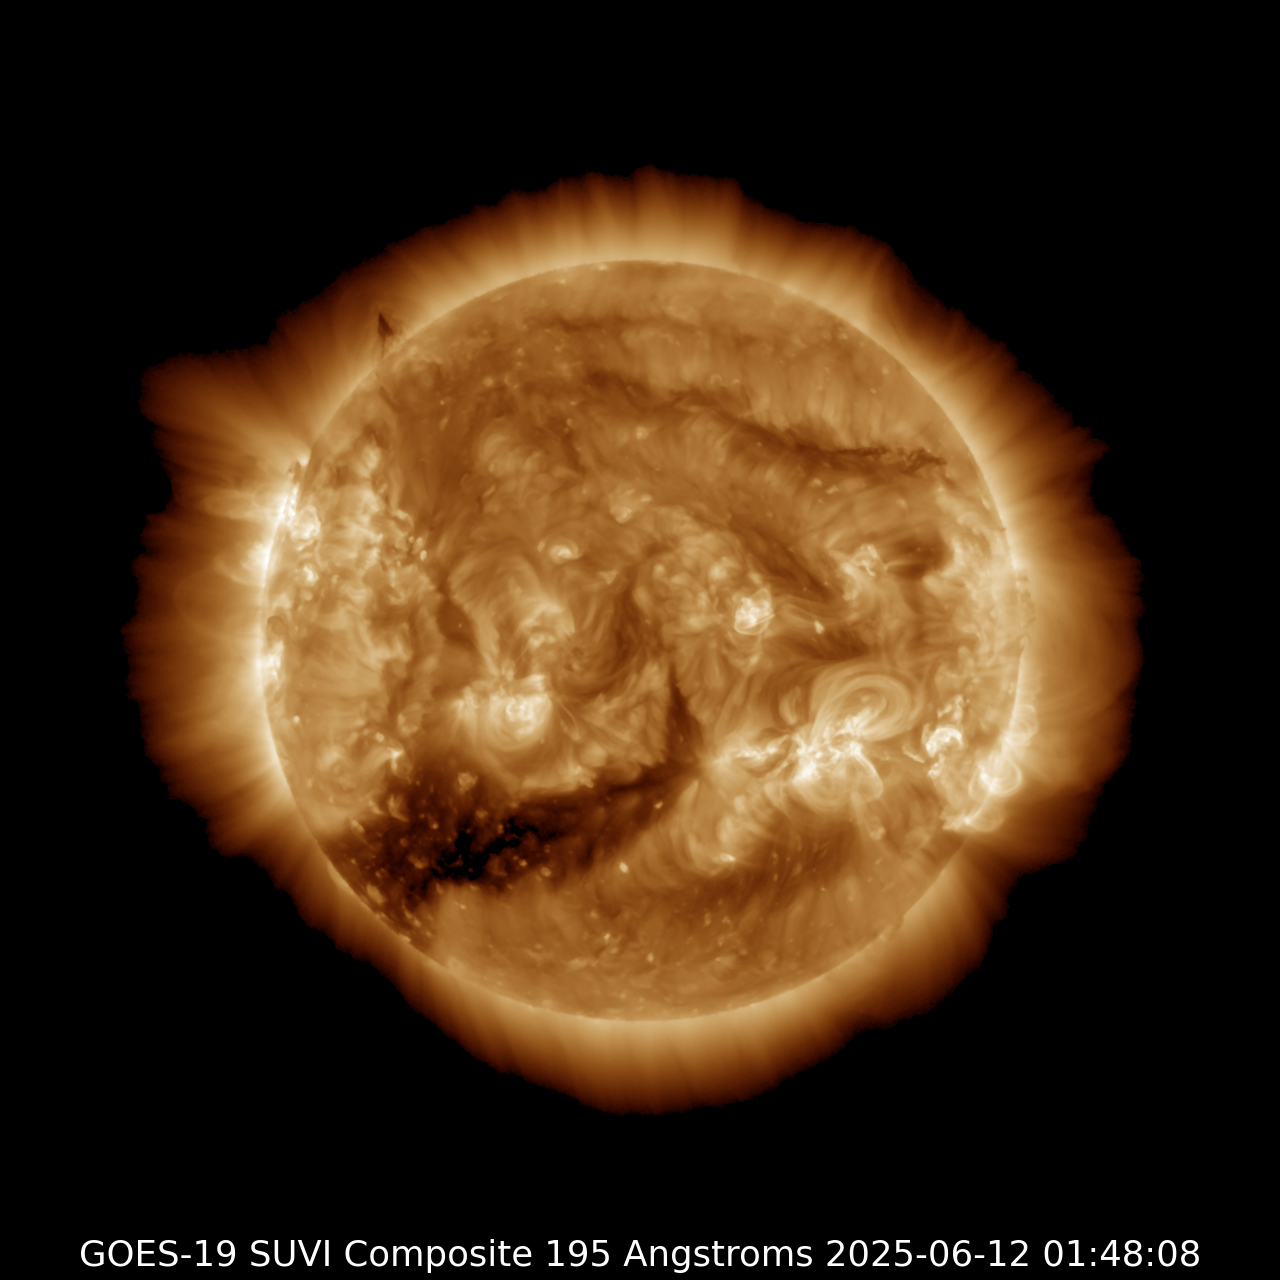
Highlights the solar corona and hot plasma. The dark areas are Coronal Holes, sources of high-speed solar wind streams that cause auroras.
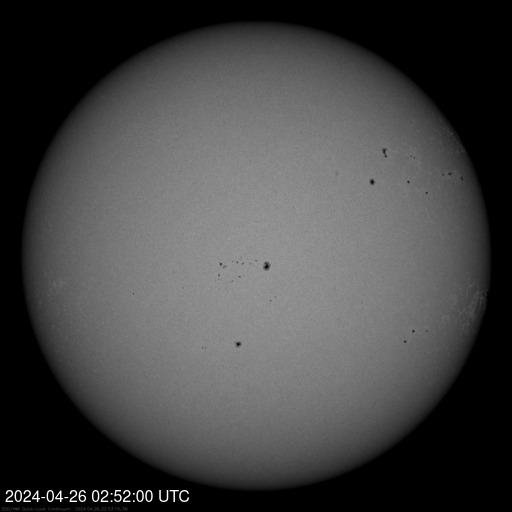
Shows the visible surface of the Sun. The dark spots are Sunspot Regions, where solar flares and CMEs originate.
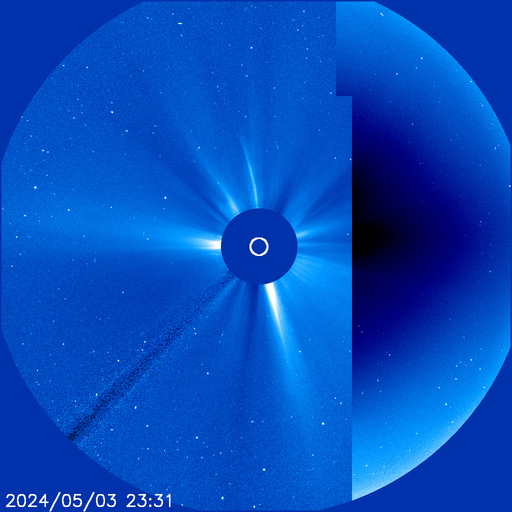
A coronagraph that blocks the solar disk to reveal the surrounding space. Essential for detecting Coronal Mass Ejections (CMEs) headed toward Earth.
Forecast Models & Solar Cycle
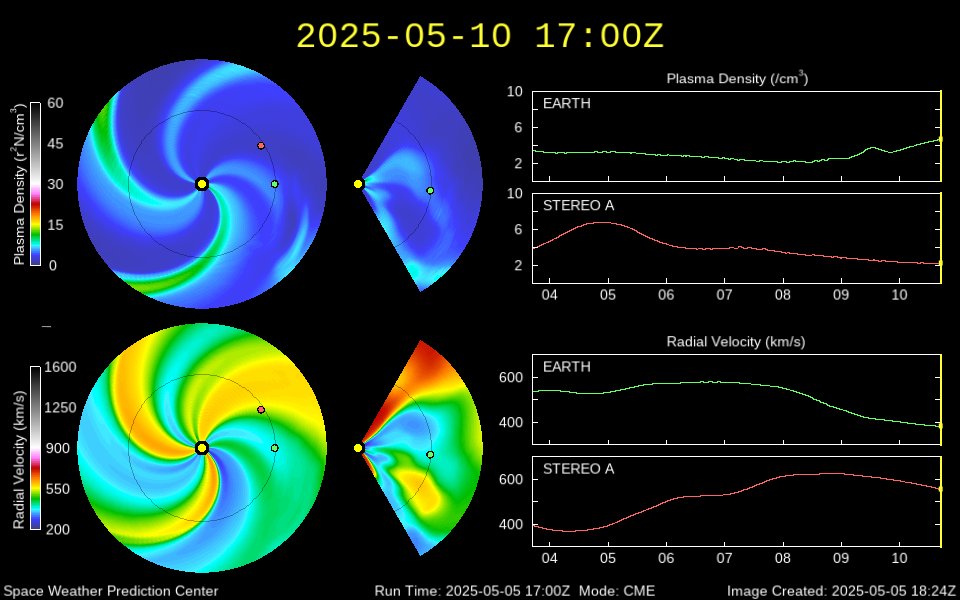
This model simulates the solar wind and the impact of CMEs (plasma clouds) on the planets. Earth is the green dot.
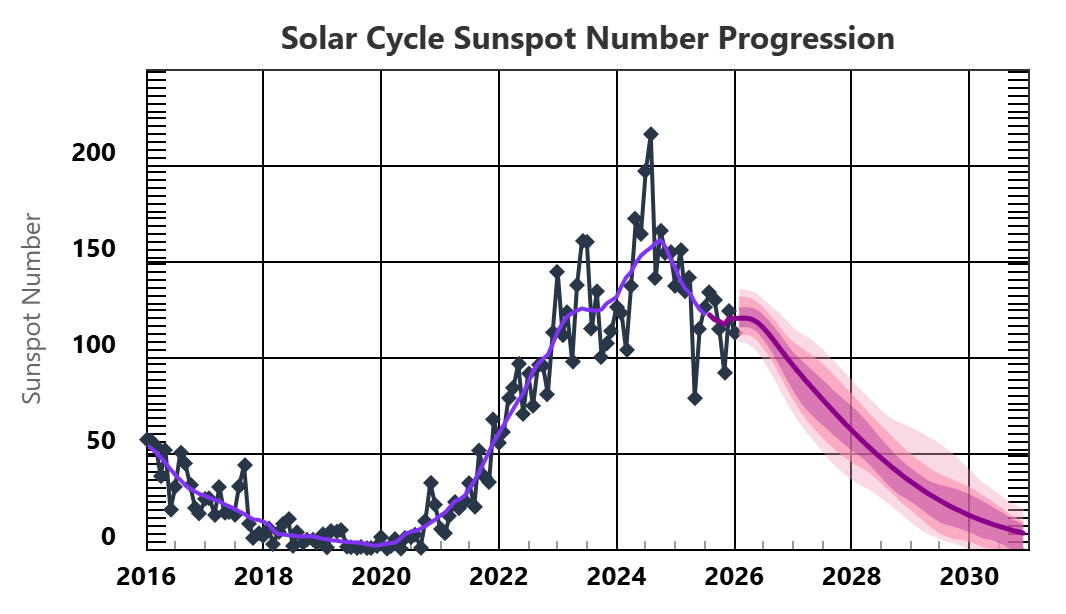
The Sun follows cycles of about 11 years. We are currently in Cycle 25. Click the chart to view NOAA's official interactive data.
Today's Statistics (Live)
M- and X-class flares are the most intense and can cause radio blackouts on Earth.
📉View Live Charton NOAA.gov →
View the interactive X-ray flux directly on the U.S. government portal.
Different wavelengths (171 Å and 304 Å) reveal hidden magnetic phenomena.
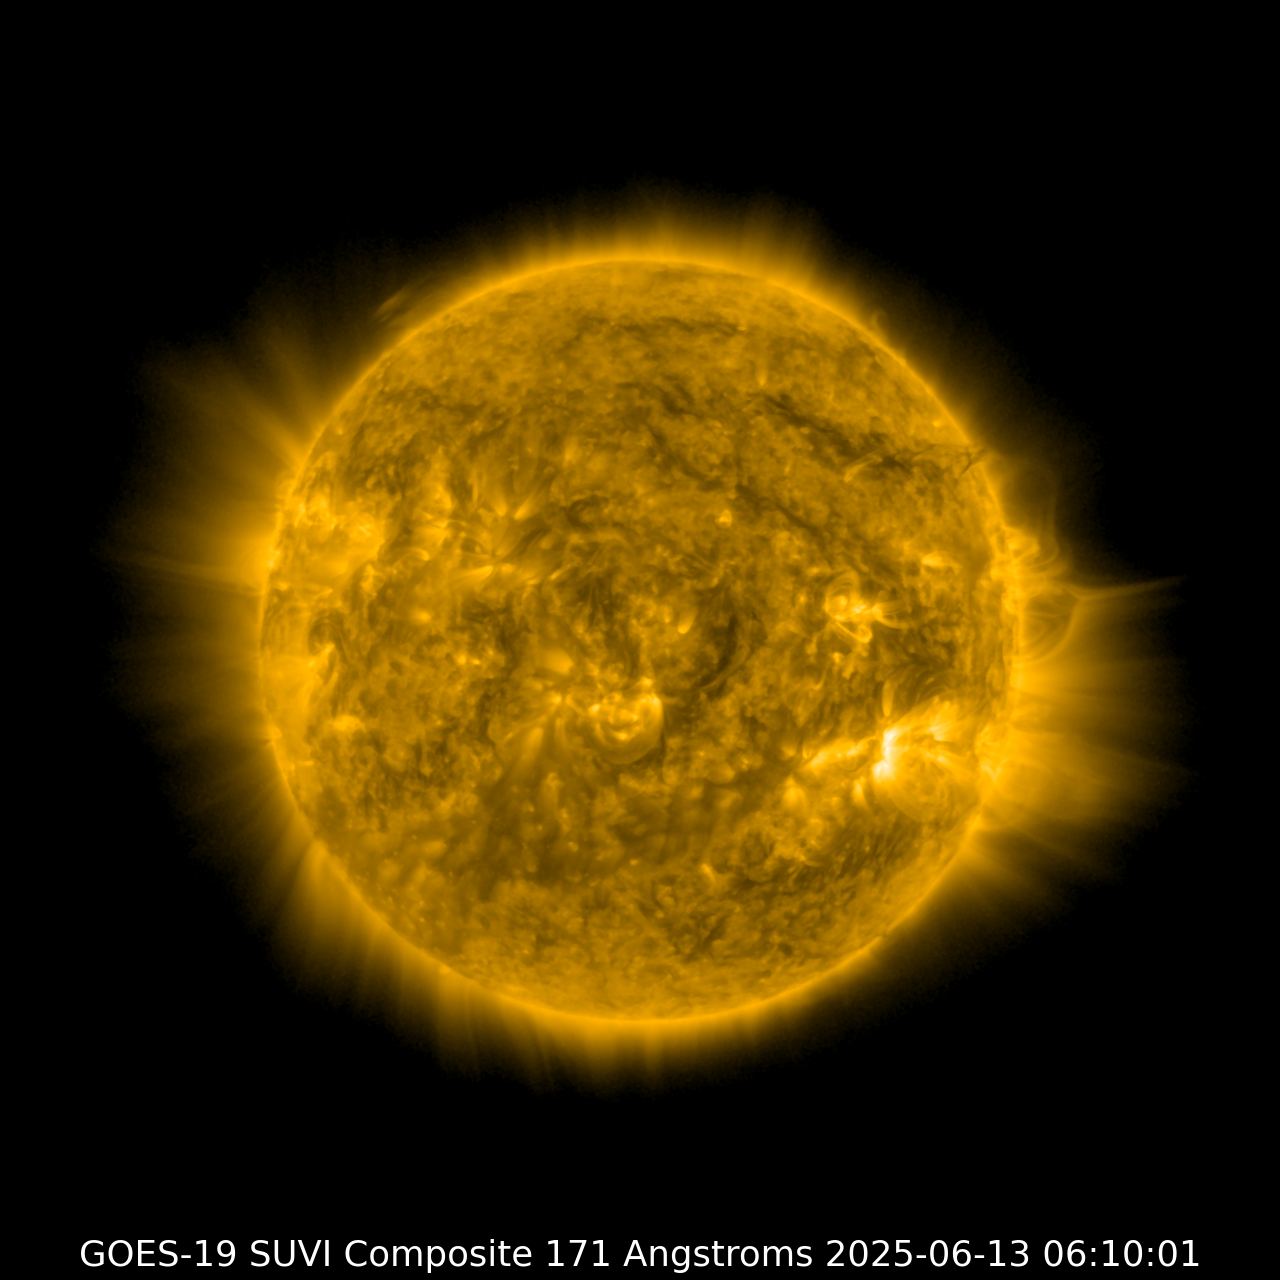
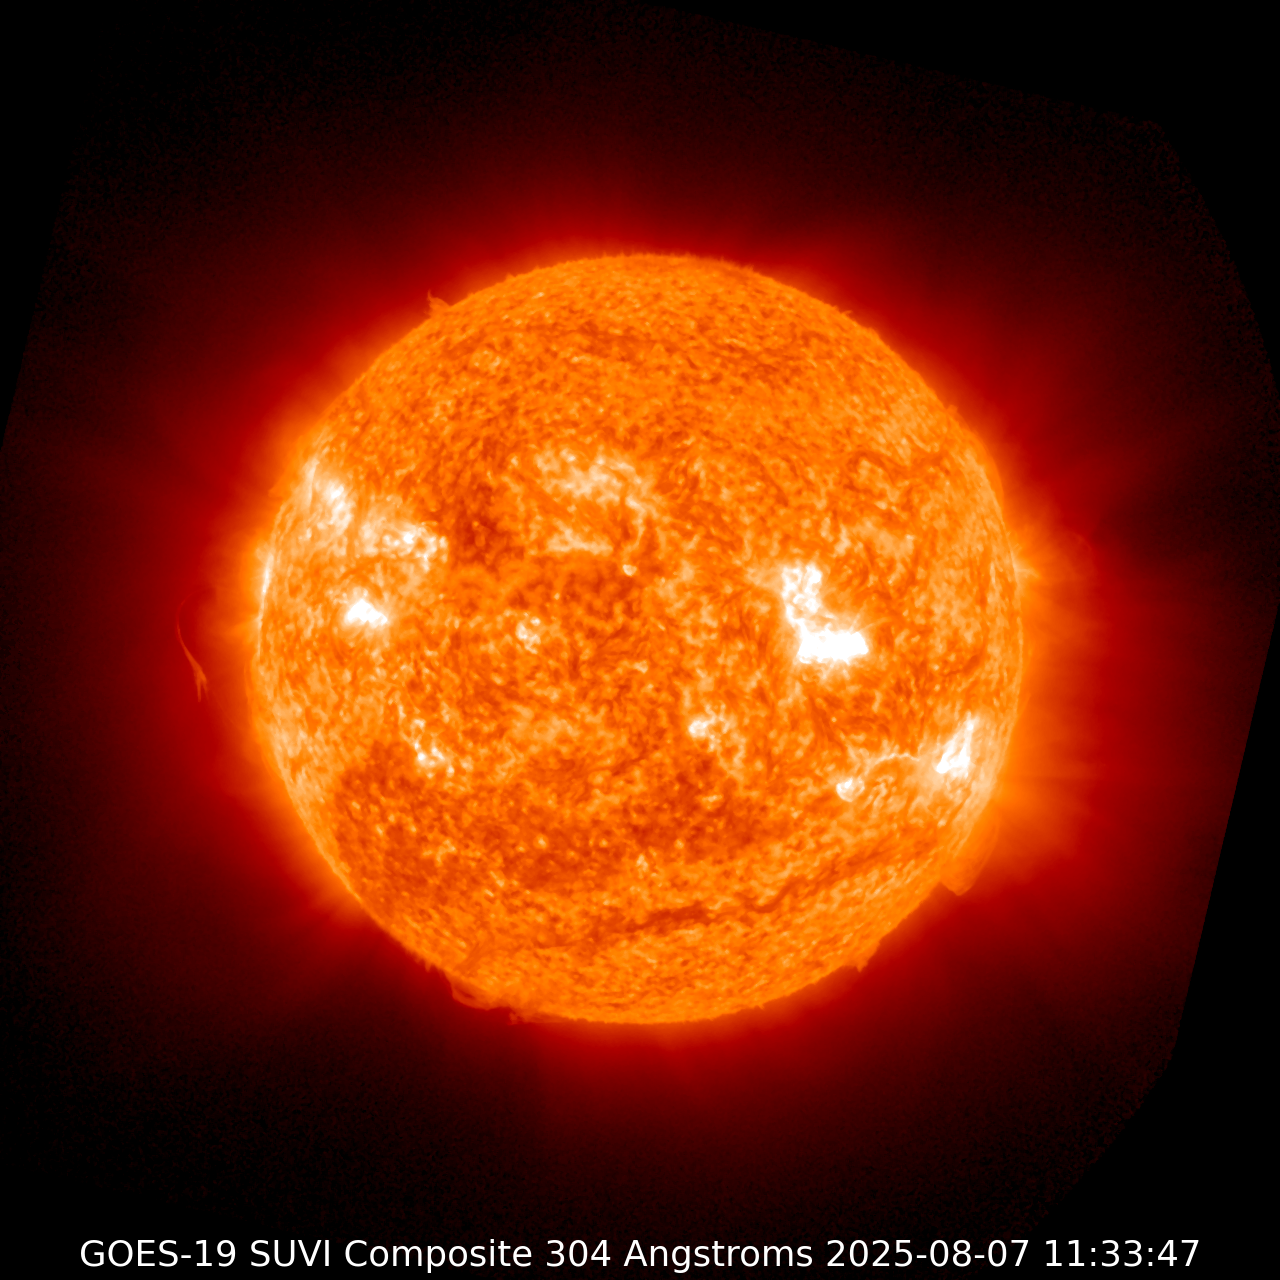
EUV images captured by the Solar Ultraviolet Imager instrument.
Get all this data analyzed and simplified directly in your pocket.
Official App
Smart notifications and probability calculations, 100% free.

