Geomagnetic Conditions
Discover the impact of the solar wind on Earth. Data retrieved in real time from the DSCOVR and ACE satellites orbiting at L1.
Real-Time Solar Wind
Solar wind speed indicates how quickly plasma travels from the Sun to Earth. Normal values range from 300-400 km/s. Above 500 km/s, geomagnetic storms become much more likely, pushing the aurora to lower latitudes.
Represents the number of plasma particles per cubic centimeter. High density (above 10 p/cm³) acts as 'fuel' for the aurora, making it extremely bright, dynamic and visible to the naked eye.
Represents the overall strength of the interplanetary magnetic field. Even if Bz is negative, a sufficiently high Bt (e.g. > 10 nT) is needed to trigger a strong geomagnetic storm.
The most important factor. It indicates the orientation of the interplanetary magnetic field (IMF). It must be negative (southward) to connect with Earth's field and allow solar particles to enter our atmosphere. The more negative, the better.
Kp Forecasts & Activity
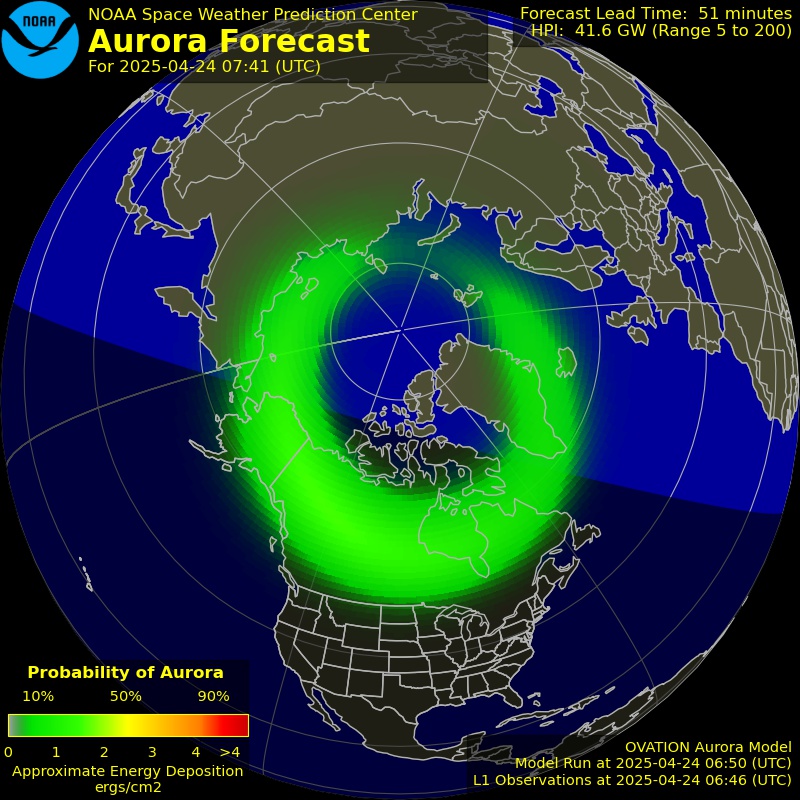
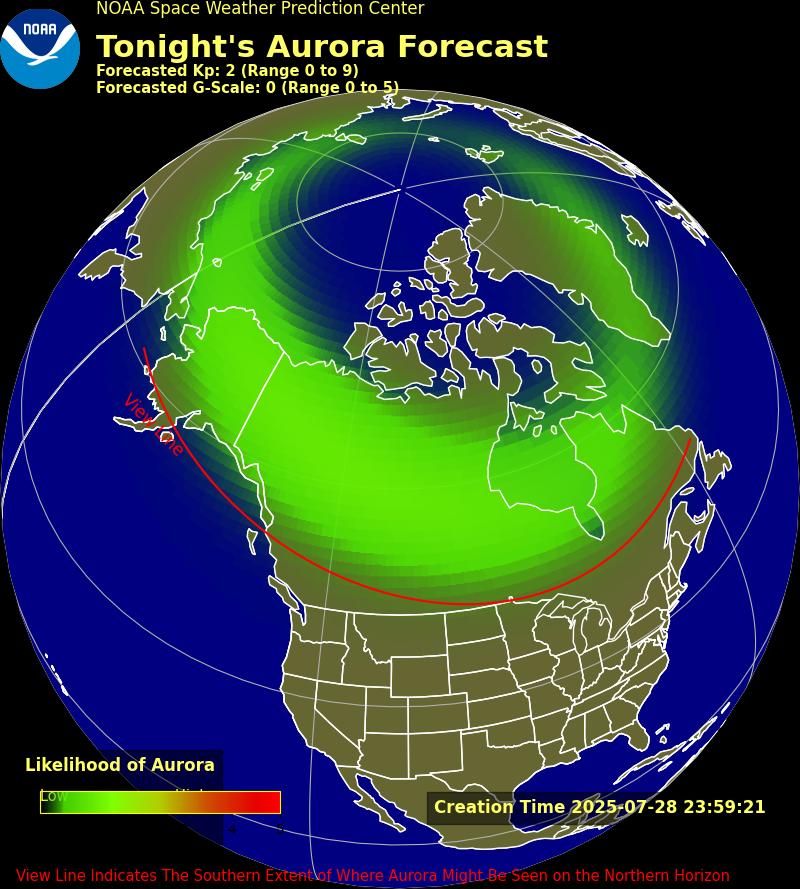
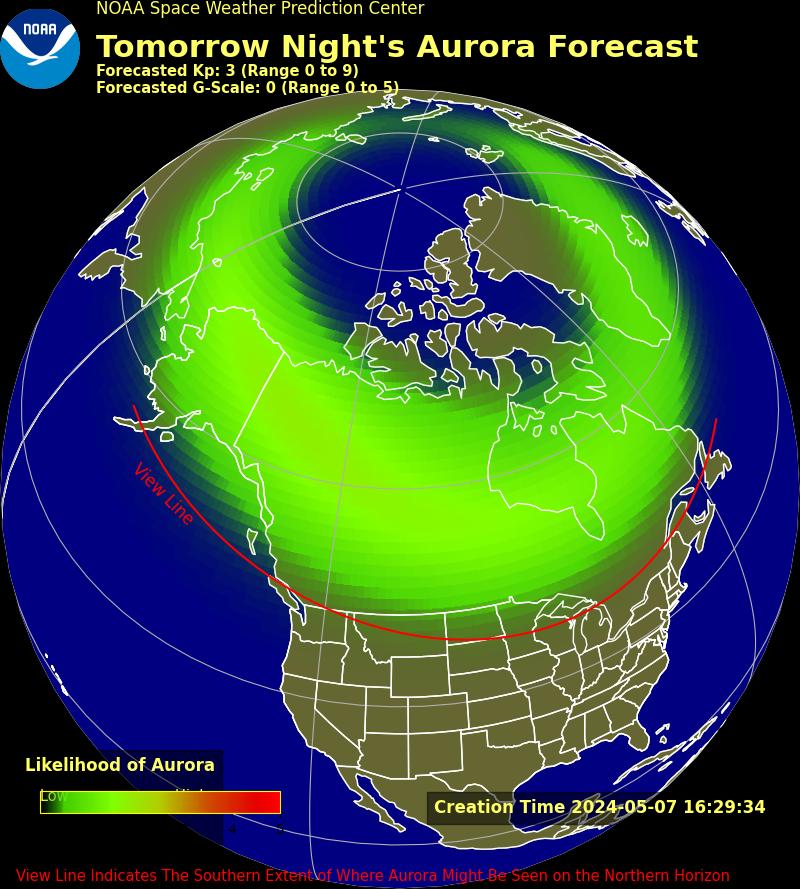
The red line (Viewline) indicates the southernmost limit where the aurora may be visible on the horizon under optimal weather conditions.
The Kp index measures disturbances in Earth's magnetic field on a scale from 0 to 9. The chart shows activity recorded over the past few hours. Green values indicate quiet conditions, yellow moderate activity, and red an ongoing storm.
Maximum Kp peaks forecast by NOAA for the next 3 days.
Energy & Space Propagation
Hemispheric Power estimates the total energy deposited by solar particles in the upper atmosphere. It is much more accurate than Kp for real-time conditions. Values below 20 GW indicate low activity. Between 50 and 100 GW, the aurora is spectacular and widespread.
This NASA/NOAA model simulates the propagation of a coronal mass ejection (CME) from the Sun to Earth. Earth is the yellow (or green) dot. A dense plasma wave (red/white) colliding with Earth indicates the imminent arrival of a strong geomagnetic storm.
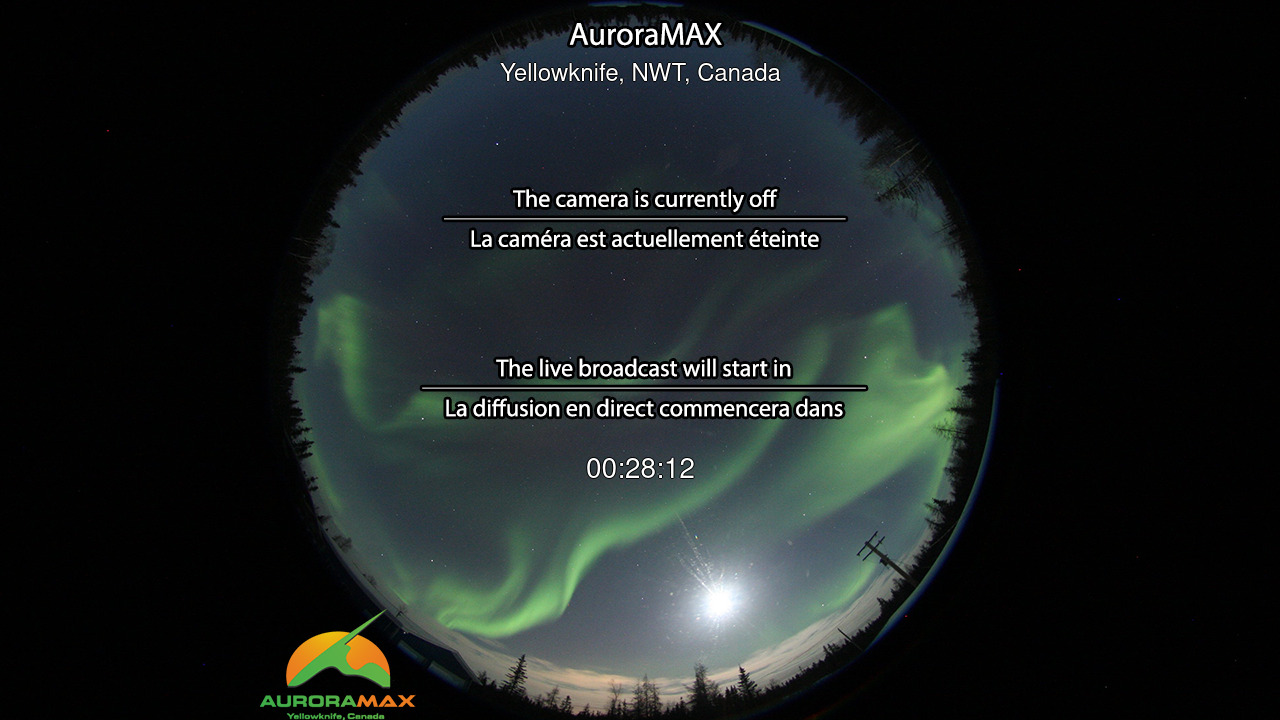
Live Webcams
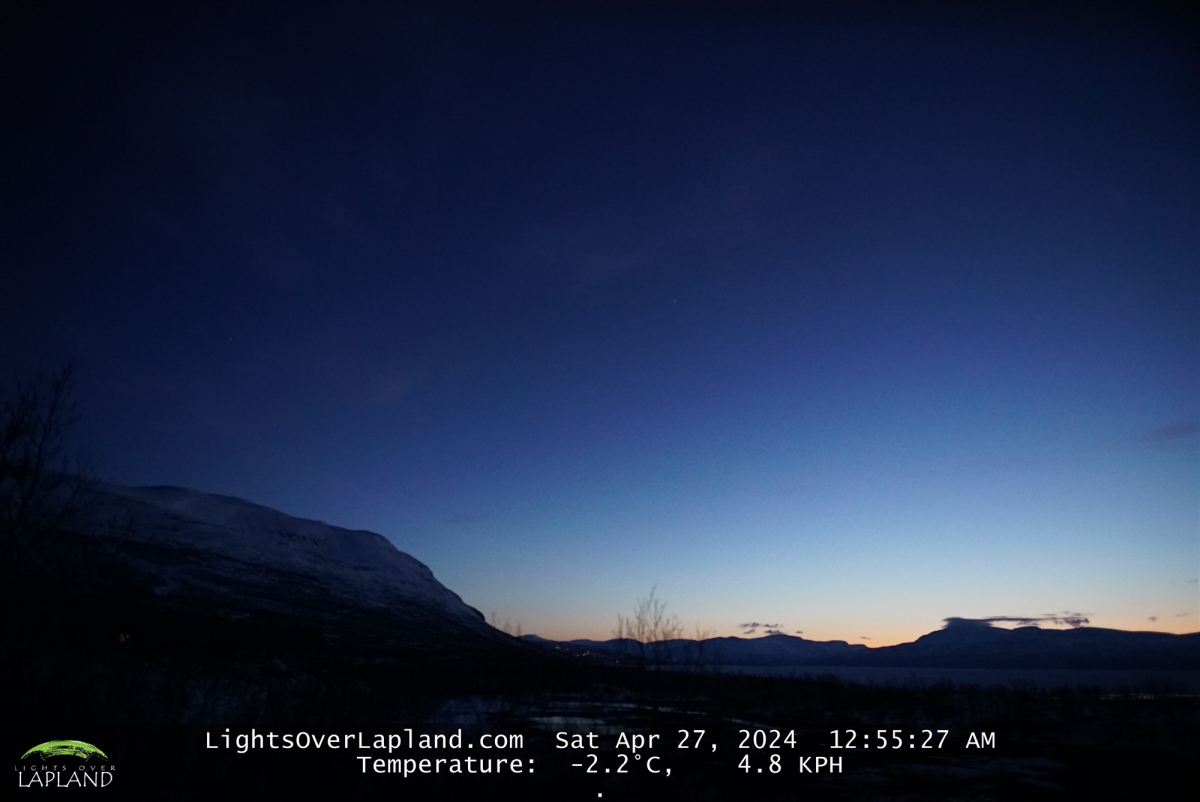
Check current activity in real time through the main Arctic webcams.

Take monitoring with you
Download the app to set custom sound alerts for Kp, negative Bz and live sightings near you.

